
And it isn't just limited to AGW issues. It has long been useful to display trends on any noisy cyclical time series data with a definite long term trend. Here are just a few examples of both ascending and descending spirals.
Note how regardless of which month you pick, the amount of Arctic Ocean ice has decreased steadily and substantially for the last 36 years. The effect, however, is most dramatic for the summer months. For the month of September, the ice volume has dropped from about 17 million km^3 1979 to 4 million km^3 in 2012. And once the thick multi-year pack ice is gone, only the thin winter freeze will be left, and it will go away every summer. What more proof could anyone possibly ask for?
https://www.google.com/url?sa=i&rct=j&q=&esrc=s&source=images&cd=&cad=rja&uact=8&ved=&url=http%3A%2F%2Fblogs.agu.org%2Flandslideblog%2F2012%2F09%2F12%2Fthe-catastrophic-loss-of-arctic-sea-ice-and-its-implications-for-landslides%2F&psig=AFQjCNE4Vjls9KJk2P2IldixfMEfYWW6jw&ust=1463142292039449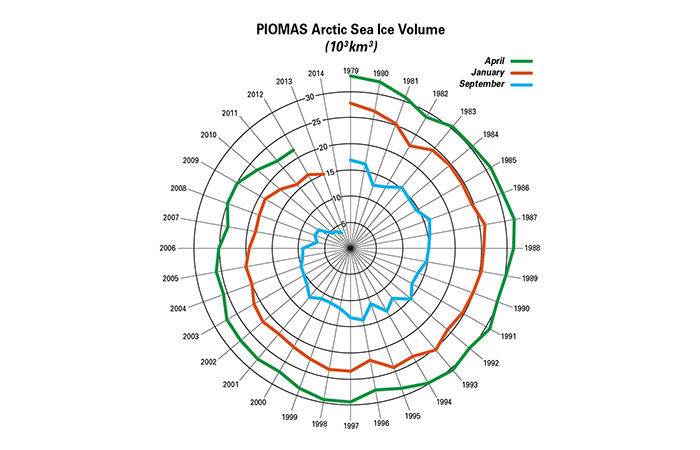

Space/Science » in reply to Spiraling global temperatures
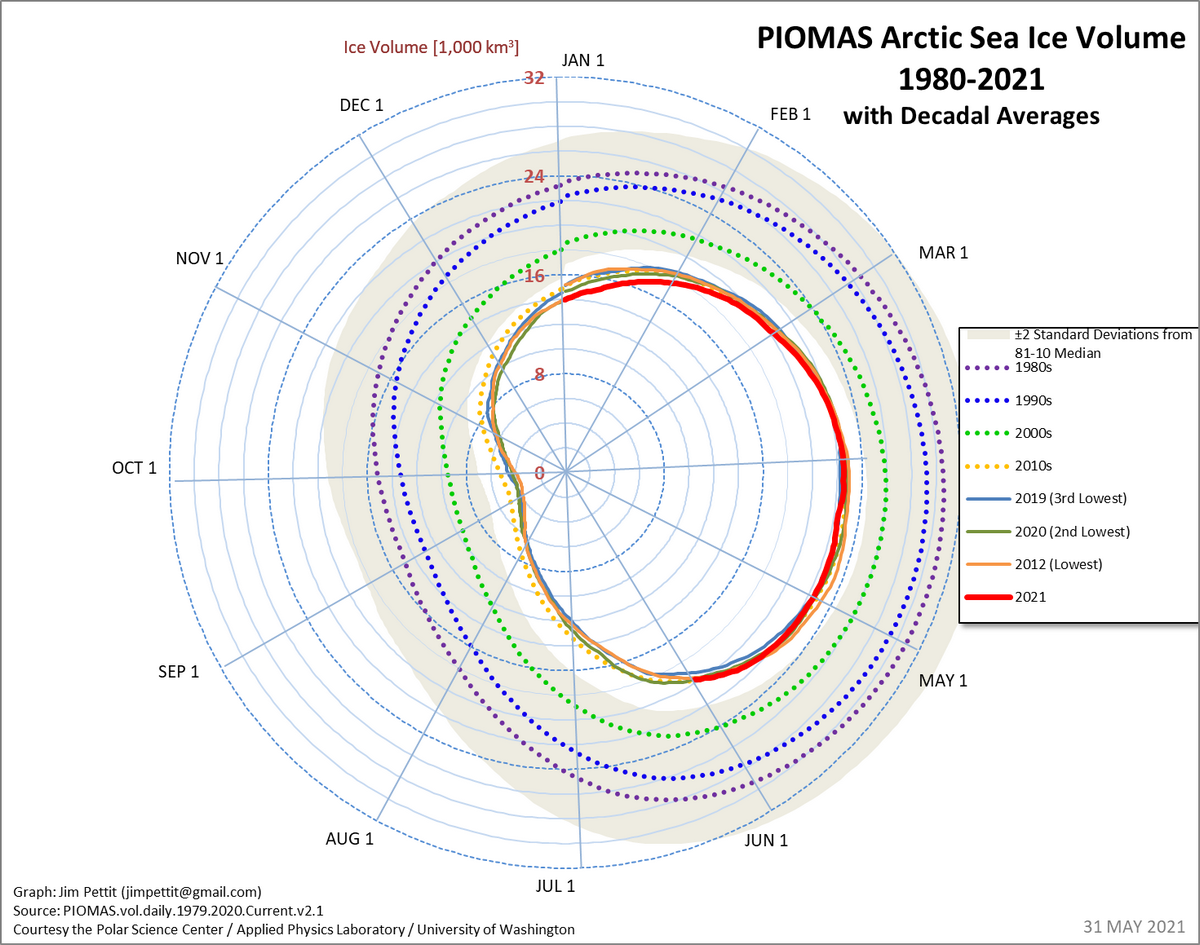
Google in image mode "arctic ice spiral graph" and you get lots of examples of this graphing technique.