
https://www.esrl.noaa.gov/gmd/ccgg/trends/
We've been neglecting the CO2 figures...let's check.
Recent Monthly Average Mauna Loa CO2
February 2018: 408.35 ppm
February 2017: 406.42 ppm
Last updated: March 5, 2018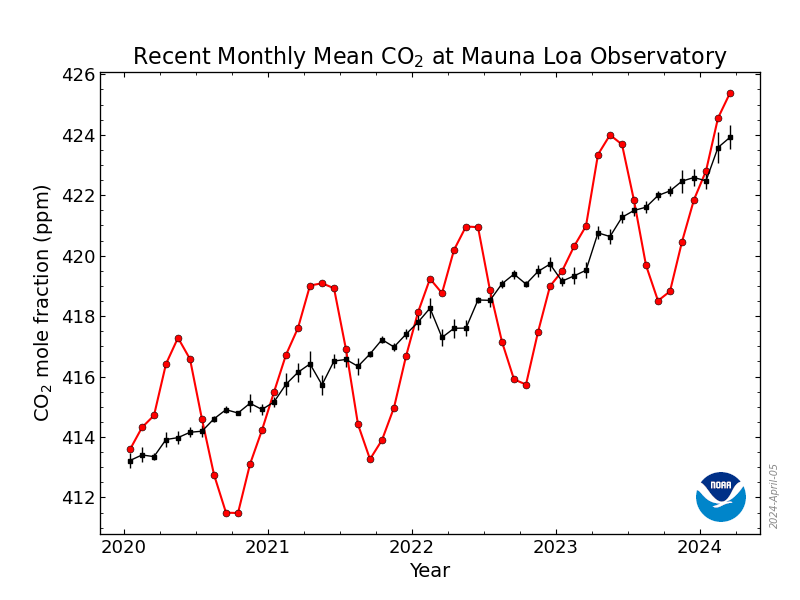
And remember, not only is the CO2 level increasing, the rate at which it is increasing is increasing.
You do realize its only a matter of time before the funding is cut for the agencies that gather and publish this data.
Lest we forget how we got in this mess...