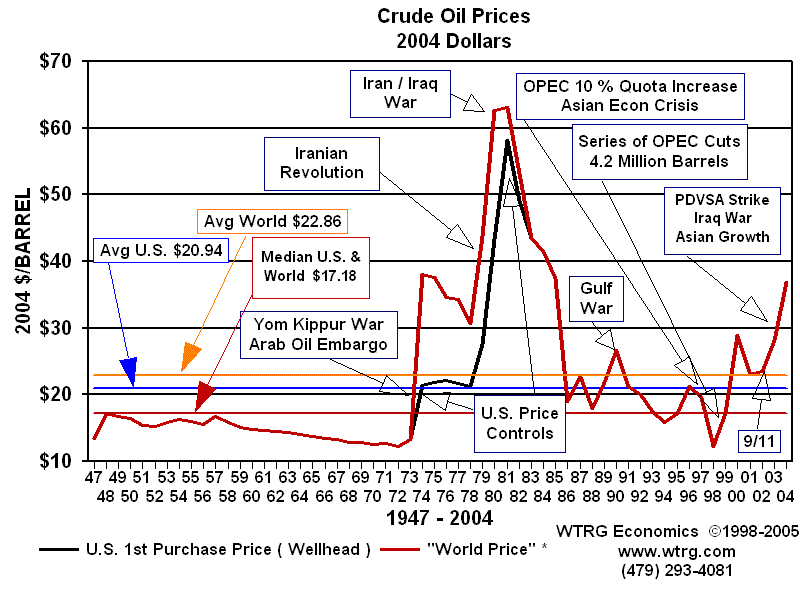
Here's one indexed to inflation
Your graph is interesting but it isn't indexed to inflation. Indexing to inflation is the only real way to compare prices over time. The graph is from 1947 through 2003. There are several other interesting graphs and explainations available here, including longer time frames and also a couple graphs that show the indexed prices compared to world events.