
Its early August, and the Arctic ice stats for July are online at NSIDC.org. Here's my summary:
Comparing average July, 2019 Sea Ice extent with the average monthly SIE for previous Julys over the last 40 years...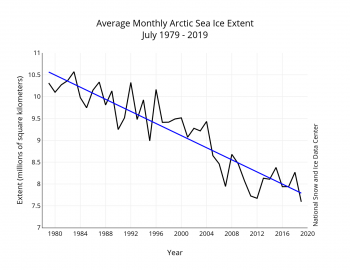
This grapic plots the time series for the entire year alongside all the time series for the previous years for the last 40 years. The four decades (eighties, nineties, oughts and tens) are highlighted by progressively more saturated color.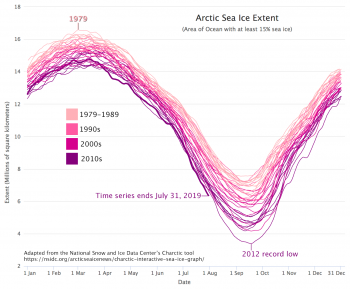
Again, keep in mind the all-time record low SIE year is 2012. Its six more weeks to the height of the melt season.
For high-res copies of these charts, go to
https://nsidc.org/arcticseaicenews/
The July numbers