
Here's a different chart.
More complicated units, but the same basic curve. This one goes back further in time.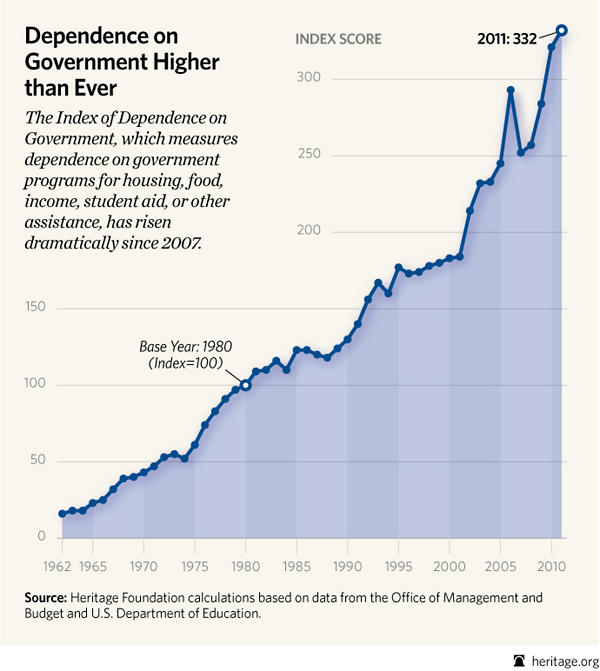
How many recessions were there during this timeline? Shouldn't the overall trend in a healthy system be flat, with peaks during bad times, and recovery to normal during good times?