Flame — HabitableZone

Flame » in reply to We don't need no stinkin' models.

Glaciers

I did a post on that issue a while back.

The graph below (I decided to post it) comes from that paper I mentioned.

http://farm4.static.flickr.com/3018/3107438591_b2b1c6e38c.jpg?v=0


Note the pattern of glacial decline, when it started, and the slope of the curve.

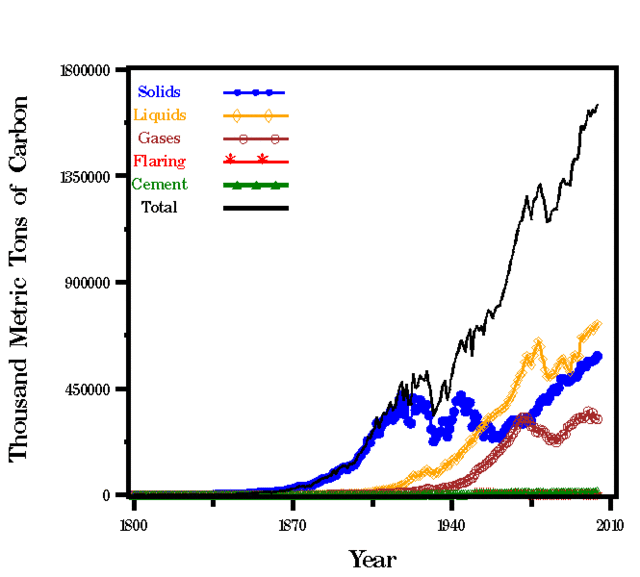
Below are some typical charts of human CO2 emissions.
http://www.coyoteblog.com/photos/uncategorized/2008/01/31/usaco2_2.gif


http://1.bp.blogspot.com/_Rgqz8UD5Vb8/Rxv2QaGeBiI/AAAAAAAAAcQ/j60poybsrdQ/s1600/481px-Carbon_History_and_Flux-2.png


Compare the curves. See the problem?

Log in or register to post.

The whole thread (23 posts)