
I use HADCRUT3v for long-term temperature trends.
Source
I find these graphs interesting. The people who do this one use 1961-1990 to create their "zero" line. I don't know why they stopped almost 20 years ago. That zero line is very important psychologically. It's what lets you do scary illustrations like this:
Note that when all is said and done, we're talking one degree C in 150 years.
More detailed chart: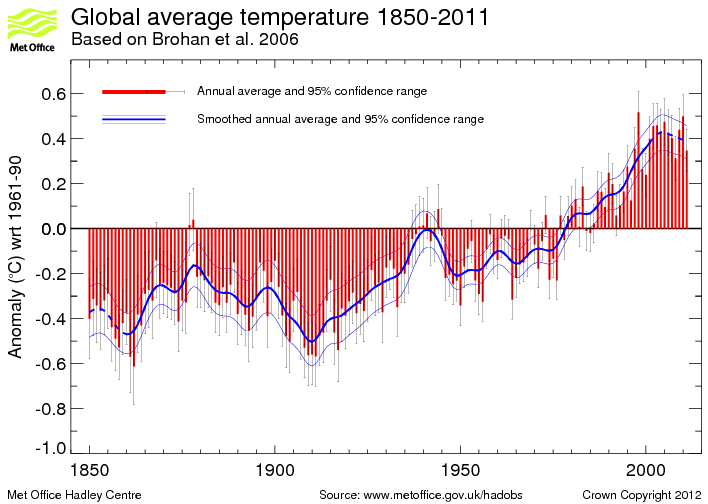
So what's actually happening now? A blip before another rise? A decade long dip like that in the 1940s followed by almost 30 years of near-flatness? A decade long dip like that in 1900 followed by 30 years of steady rise? Until the 1940s dip? How long before we know?
What would the chart look like if it were possible to shove it back several hundred more years (past the Little Ice Age)?
Space/Science » in reply to speaking of livelihoods, my bet offer is open
Based on what results?
The whole thread (62 posts)
- A warmer Finland
- re: A warmer Finland
- re: A warmer Finland
- Obviously...
- Can't stop that CO2
- The Larsen Ice Shelf
- "Glasser acknowledges that global warming had a major part to play in the collapse," (n/t)
- Media Hype on ´Melting´ Antarctic Ignores Record Ice Growth
- good job linking to a March report instead of current ones
- It isn't just about sea ice. It's the total mass balance of Antarctica
- and the models say increased snowfall in the Antarctic, so no contradiction
- Okay, then Greenland.
- It's the IPCC that counts
- I guess that settles it then.
- never happened
- re: never happened
- speaking of livelihoods, my bet offer is open
- Based on what results?
- re: speaking of livelihoods, my bet offer is open
- speaking of livelihoods, my bet offer is open
- There is a reason it was originally named GREENLAND and not ICELAND. (n/t)
- re: never happened
- never happened
- I guess that settles it then.
- re: Okay, then Greenland.
- It's the IPCC that counts
- Okay, then Greenland.
- and the models say increased snowfall in the Antarctic, so no contradiction
- It isn't just about sea ice. It's the total mass balance of Antarctica
- good job linking to a March report instead of current ones
- Media Hype on ´Melting´ Antarctic Ignores Record Ice Growth
- "Glasser acknowledges that global warming had a major part to play in the collapse," (n/t)
- re: Obviously...
- re: Obviously...
- re: A warmer Finland
- Obviously...
- re: A warmer Finland
- re: A warmer Finland